Rock Products is the aggregates industry's leading source for market analysis and technology solutions, delivering critical content focusing on aggregates-processing equipment; operational efficiencies; management best practices; comprehensive market
Issue link: https://rock.epubxp.com/i/1008221
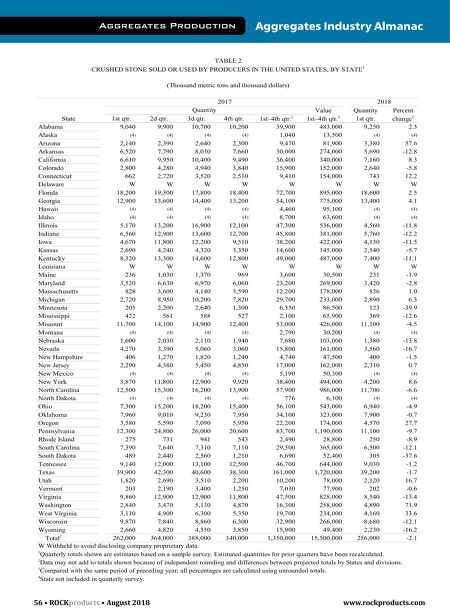
56 • ROCK products • August 2018 www.rockproducts.com Aggregates Industry Almanac Aggregates Production Value Quantity Percent State 1st qtr. 2d qtr. 3d qtr. 4th qtr. 1st–4th qtr. 2 1st–4th qtr. 2 1st qtr. change 3 Alabama 9,040 9,900 10,700 10,200 39,900 483,000 9,250 2.3 Alaska (4) (4) (4) (4) 1,040 13,500 (4) (4) Arizona 2,140 2,390 2,640 2,300 9,470 81,900 3,380 57.6 Arkansas 6,520 7,790 8,030 7,660 30,000 274,000 5,690 -12.8 California 6,610 9,950 10,400 9,490 36,400 340,000 7,160 8.3 Colorado 2,800 4,280 4,940 3,840 15,900 152,000 2,640 -5.8 Connecticut 662 2,720 3,520 2,510 9,410 154,000 743 12.2 Delaware W W W W W W W W Florida 18,200 19,300 17,800 18,400 72,700 895,000 18,600 2.5 Georgia 12,900 13,600 14,400 13,200 54,100 775,000 13,400 4.1 Hawaii (4) (4) (4) (4) 4,460 95,100 (4) (4) Idaho (4) (4) (4) (4) 8,700 63,600 (4) (4) Illinois 5,170 13,200 16,900 12,100 47,300 536,000 4,560 -11.8 Indiana 6,560 12,900 13,600 12,700 45,800 381,000 5,760 -12.2 Iowa 4,670 11,800 12,200 9,510 38,200 422,000 4,130 -11.5 Kansas 2,690 4,240 4,320 3,350 14,600 145,000 2,540 -5.7 Kentucky 8,320 13,300 14,600 12,800 49,000 487,000 7,400 -11.1 Louisiana W W W W W W W W Maine 236 1,030 1,370 969 3,600 30,500 231 -1.9 Maryland 3,520 6,630 6,970 6,060 23,200 269,000 3,420 -2.8 Massachusetts 828 3,600 4,140 3,590 12,200 178,000 836 1.0 Michigan 2,720 8,950 10,200 7,820 29,700 233,000 2,890 6.3 Minnesota 205 2,200 2,640 1,300 6,350 86,500 123 -39.9 Mississippi 422 561 588 527 2,100 65,900 369 -12.6 Missouri 11,700 14,100 14,900 12,400 53,000 426,000 11,100 -4.5 Montana (4) (4) (4) (4) 2,790 30,200 (4) (4) Nebraska 1,600 2,030 2,110 1,940 7,680 103,000 1,380 -13.8 Nevada 4,270 3,390 5,060 3,060 15,800 161,000 3,560 -16.7 New Hampshire 406 1,270 1,820 1,240 4,740 47,500 400 -1.5 New Jersey 2,290 4,380 5,450 4,850 17,000 162,000 2,310 0.7 New Mexico (4) (4) (4) (4) 5,190 50,300 (4) (4) New York 3,870 11,800 12,900 9,920 38,400 494,000 4,200 8.6 North Carolina 12,500 15,300 16,200 13,900 57,900 986,000 11,700 -6.6 North Dakota (4) (4) (4) (4) 776 6,100 (4) (4) Ohio 7,300 15,200 18,200 15,400 56,100 543,000 6,940 -4.9 Oklahoma 7,960 9,010 9,230 7,950 34,100 323,000 7,900 -0.7 Oregon 3,580 5,590 7,090 5,950 22,200 174,000 4,570 27.7 Pennsylvania 12,300 24,800 26,000 20,600 83,700 1,190,000 11,100 -9.7 Rhode Island 275 731 941 543 2,490 28,800 250 -8.9 South Carolina 7,390 7,640 7,310 7,110 29,500 365,000 6,500 -12.1 South Dakota 489 2,440 2,560 1,210 6,690 52,400 305 -37.6 Tennessee 9,140 12,000 13,100 12,500 46,700 644,000 9,030 -1.2 Texas 39,900 42,300 40,600 38,300 161,000 1,720,000 39,200 -1.7 Utah 1,820 2,690 3,510 2,200 10,200 78,000 2,120 16.7 Vermont 203 2,190 3,400 1,250 7,030 77,900 202 -0.6 Virginia 9,860 12,900 12,900 11,800 47,500 828,000 8,540 -13.4 Washington 2,840 3,470 5,130 4,870 16,300 258,000 4,890 71.9 West Virginia 3,110 4,900 6,300 5,350 19,700 234,000 4,160 33.6 Wisconsin 9,870 7,840 8,860 6,300 32,900 266,000 8,680 -12.1 Wyoming 2,660 4,820 4,550 3,850 15,900 49,400 2,230 -16.2 Total 2 262,000 364,000 388,000 340,000 1,350,000 15,500,000 256,000 -2.1 W Withheld to avoid disclosing company proprietary data. 1 Quarterly totals shown are estimates based on a sample survey. Estimated quantities for prior quarters have been recalculated. 2 Data may not add to totals shown because of independent rounding and differences between projected totals by States and divisions. 3 Compared with the same period of preceding year; all percentages are calculated using unrounded totals. 4 State not included in quarterly survey. Quantity 2017 2018 TABLE 2 CRUSHED STONE SOLD OR USED BY PRODUCERS IN THE UNITED STATES, BY STATE 1 (Thousand metric tons and thousand dollars)