Rock Products is the aggregates industry's leading source for market analysis and technology solutions, delivering critical content focusing on aggregates-processing equipment; operational efficiencies; management best practices; comprehensive market
Issue link: https://rock.epubxp.com/i/1008221
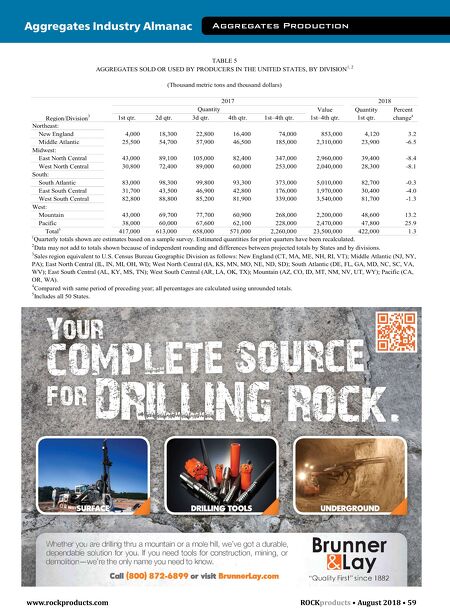
www.rockproducts.com ROCK products • August 2018 • 59 Aggregates Industry Almanac Aggregates Production Value Quantity Percent Region/Division 3 1st qtr. 2d qtr. 3d qtr. 4th qtr. 1st–4th qtr. 1st–4th qtr. 1st qtr. change 4 Northeast: New England 4,000 18,300 22,800 16,400 74,000 853,000 4,120 3.2 Middle Atlantic 25,500 54,700 57,900 46,500 185,000 2,310,000 23,900 -6.5 Midwest: East North Central 43,000 89,100 105,000 82,400 347,000 2,960,000 39,400 -8.4 West North Central 30,800 72,400 89,000 60,000 253,000 2,040,000 28,300 -8.1 South: South Atlantic 83,000 98,300 99,800 93,300 373,000 5,010,000 82,700 -0.3 East South Central 31,700 43,500 46,900 42,800 176,000 1,970,000 30,400 -4.0 West South Central 82,800 88,800 85,200 81,900 339,000 3,540,000 81,700 -1.3 West: Mountain 43,000 69,700 77,700 60,900 268,000 2,200,000 48,600 13.2 Pacific 38,000 60,000 67,600 62,100 228,000 2,470,000 47,800 25.9 Total 5 417,000 613,000 658,000 571,000 2,260,000 23,500,000 422,000 1.3 1 Quarterly totals shown are estimates based on a sample survey. Estimated quantities for prior quarters have been recalculated. 2 Data may not add to totals shown because of independent rounding and differences between projected totals by States and by divisions. 3 Sales region equivalent to U.S. Census Bureau Geographic Division as follows: New England (CT, MA, ME, NH, RI, VT); Middle Atlantic (NJ, NY, PA); East North Central (IL, IN, MI, OH, WI); West North Central (IA, KS, MN, MO, NE, ND, SD); South Atlantic (DE, FL, GA, MD, NC, SC, VA, WV); East South Central (AL, KY, MS, TN); West South Central (AR, LA, OK, TX); Mountain (AZ, CO, ID, MT, NM, NV, UT, WY); Pacific (CA, OR, WA). 4 Compared with same period of preceding year; all percentages are calculated using unrounded totals. 5 Includes all 50 States. Quantity 2017 2018 TABLE 5 AGGREGATES SOLD OR USED BY PRODUCERS IN THE UNITED STATES, BY DIVISION 1, 2 (Thousand metric tons and thousand dollars) Whether you are drilling thru a mountain or a mole hill, we've got a durable, dependable solution for you. If you need tools for construction, mining, or demolition-we're the only name you need to know. Call (800) 872-6899 or vs Brunnerlay.com Brunner � Lay "Quality First" since 1882