Rock Products is the aggregates industry's leading source for market analysis and technology solutions, delivering critical content focusing on aggregates-processing equipment; operational efficiencies; management best practices; comprehensive market
Issue link: https://rock.epubxp.com/i/1008221
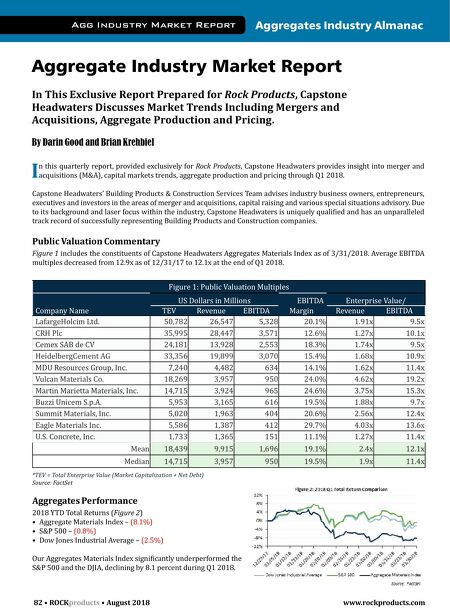
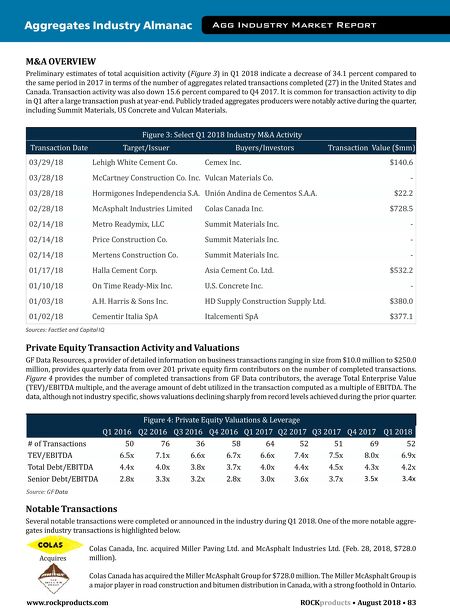
82 • ROCK products • August 2018 www.rockproducts.com I n this quarterly report, provided exclusively for Rock Products, Capstone Headwaters provides insight into merger and acquisitions (M&A;), capital markets trends, aggregate production and pricing through Q1 2018. Capstone Headwaters' Building Products & Construction Services Team advises industry business owners, entrepreneurs, executives and investors in the areas of merger and acquisitions, capital raising and various special situations advisory. Due to its background and laser focus within the industry, Capstone Headwaters is uniquely qualified and has an unparalleled track record of successfully representing Building Products and Construction companies. Public Valuation Commentary Figure 1 includes the constituents of Capstone Headwaters Aggregates Materials Index as of 3/31/2018. Average EBITDA multiples decreased from 12.9x as of 12/31/17 to 12.1x at the end of Q1 2018. Figure 1: Public Valuation Multiples US Dollars in Millions EBITDA Enterprise Value/ Company Name TEV Revenue EBITDA Margin Revenue EBITDA LafargeHolcim Ltd. 50,782 26,547 5,328 20.1% 1.91x 9.5x CRH Plc 35,995 28,447 3,571 12.6% 1.27x 10.1x Cemex SAB de CV 24,181 13,928 2,553 18.3% 1.74x 9.5x HeidelbergCement AG 33,356 19,899 3,070 15.4% 1.68x 10.9x MDU Resources Group, Inc. 7,240 4,482 634 14.1% 1.62x 11.4x Vulcan Materials Co. 18,269 3,957 950 24.0% 4.62x 19.2x Martin Marietta Materials, Inc. 14,715 3,924 965 24.6% 3.75x 15.3x Buzzi Unicem S.p.A. 5,953 3,165 616 19.5% 1.88x 9.7x Summit Materials, Inc. 5,020 1,963 404 20.6% 2.56x 12.4x Eagle Materials Inc. 5,586 1,387 412 29.7% 4.03x 13.6x U.S. Concrete, Inc. 1,733 1,365 151 11.1% 1.27x 11.4x Mean 18,439 9,915 1,696 19.1% 2.4x 12.1x Median 14,715 3,957 950 19.5% 1.9x 11.4x *TEV = Total Enterprise Value (Market Capitalization + Net Debt) Source: FactSet Aggregates Performance 2018 YTD Total Returns (Figure 2) • Aggregate Materials Index – (8.1%) • S&P; 500 – (0.8%) • Dow Jones Industrial Average – (2.5%) Our Aggregates Materials Index significantly underperformed the S&P; 500 and the DJIA, declining by 8.1 percent during Q1 2018. Aggregates Industry Almanac Agg Industry Market Report Aggregate Industry Market Report In This Exclusive Report Prepared for Rock Products, Capstone Headwaters Discusses Market Trends Including Mergers and Acquisitions, Aggregate Production and Pricing. By Darin Good and Brian Krehbiel