Rock Products is the aggregates industry's leading source for market analysis and technology solutions, delivering critical content focusing on aggregates-processing equipment; operational efficiencies; management best practices; comprehensive market
Issue link: https://rock.epubxp.com/i/1008221
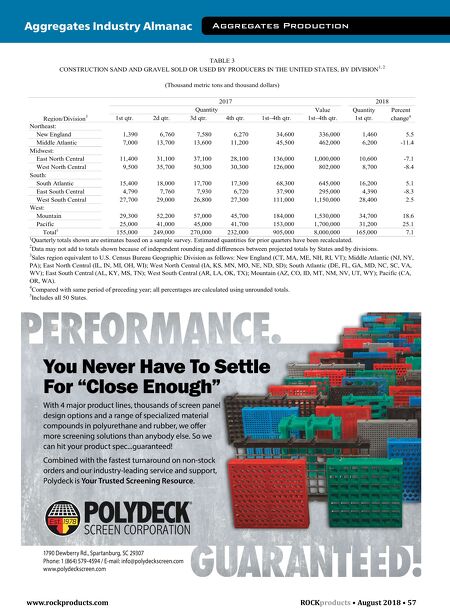
www.rockproducts.com ROCK products • August 2018 • 57 Aggregates Industry Almanac Aggregates Production Value Quantity Percent Region/Division 3 1st qtr. 2d qtr. 3d qtr. 4th qtr. 1st–4th qtr. 1st–4th qtr. 1st qtr. change 4 Northeast: New England 1,390 6,760 7,580 6,270 34,600 336,000 1,460 5.5 Middle Atlantic 7,000 13,700 13,600 11,200 45,500 462,000 6,200 -11.4 Midwest: East North Central 11,400 31,100 37,100 28,100 136,000 1,000,000 10,600 -7.1 West North Central 9,500 35,700 50,300 30,300 126,000 802,000 8,700 -8.4 South: South Atlantic 15,400 18,000 17,700 17,300 68,300 645,000 16,200 5.1 East South Central 4,790 7,760 7,930 6,720 37,900 295,000 4,390 -8.3 West South Central 27,700 29,000 26,800 27,300 111,000 1,150,000 28,400 2.5 West: Mountain 29,300 52,200 57,000 45,700 184,000 1,530,000 34,700 18.6 Pacific 25,000 41,000 45,000 41,700 153,000 1,700,000 31,200 25.1 Total 5 155,000 249,000 270,000 232,000 905,000 8,000,000 165,000 7.1 1 Quarterly totals shown are estimates based on a sample survey. Estimated quantities for prior quarters have been recalculated. 2 Data may not add to totals shown because of independent rounding and differences between projected totals by States and by divisions. 3 Sales region equivalent to U.S. Census Bureau Geographic Division as follows: New England (CT, MA, ME, NH, RI, VT); Middle Atlantic (NJ, NY, PA); East North Central (IL, IN, MI, OH, WI); West North Central (IA, KS, MN, MO, NE, ND, SD); South Atlantic (DE, FL, GA, MD, NC, SC, VA, WV); East South Central (AL, KY, MS, TN); West South Central (AR, LA, OK, TX); Mountain (AZ, CO, ID, MT, NM, NV, UT, WY); Pacific (CA, OR, WA). 4 Compared with same period of preceding year; all percentages are calculated using unrounded totals. 5 Includes all 50 States. 2017 2018 Quantity TABLE 3 CONSTRUCTION SAND AND GRAVEL SOLD OR USED BY PRODUCERS IN THE UNITED STATES, BY DIVISION 1, 2 (Thousand metric tons and thousand dollars) You Never Have To Settle For "Close Enough" With 4 major product lines, thousands of screen panel design options and a range of specialized material compounds in polyurethane and rubber, we offer more screening solutions than anybody else. So we can hit your product spec...guaranteed! Combined with the fastest turnaround on non-stock orders and our industry-leading service and support, Polydeck is Your Trusted Screening Resource. 1790 Dewberry Rd., Spartanburg, SC 29307 Phone: 1 (864) 579-4594 / E-mail: info@polydeckscreen.com www.polydeckscreen.com